
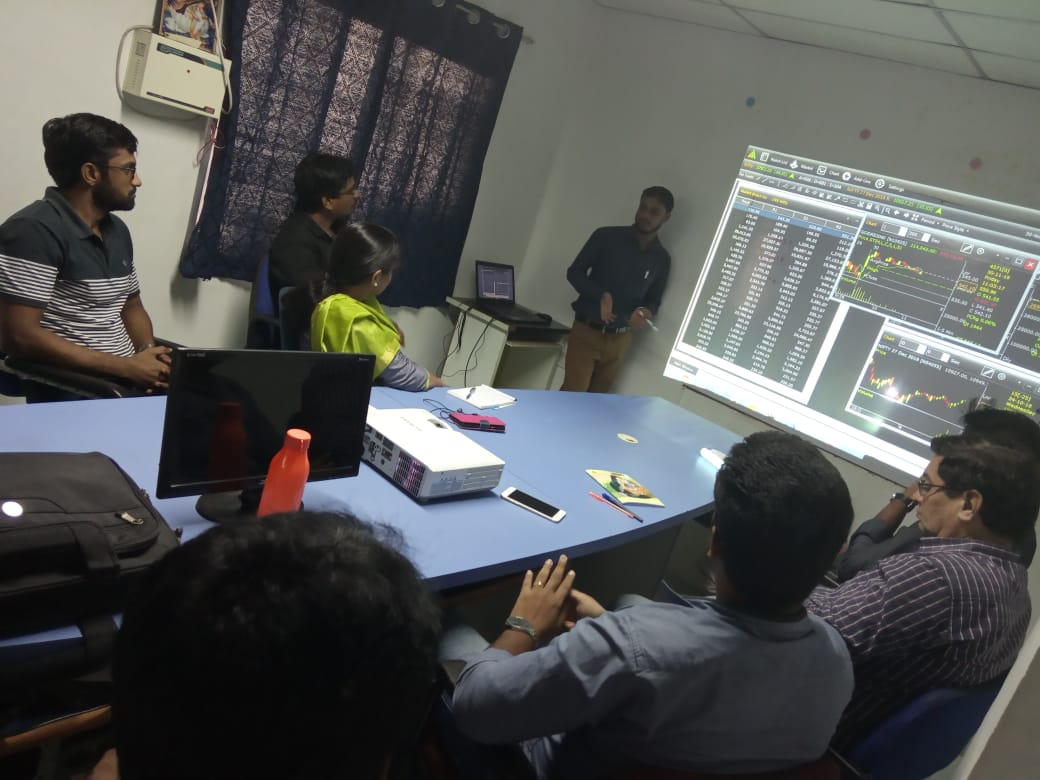
Candlestick charts show price movement over a period — open, high, low and close. Each candle is a snapshot of buying and selling pressure.
Beginners often start with trend direction, support/resistance zones and a few common patterns. Charts are tools for learning market behaviour — not guarantees.
Education only: We do not provide stock tips or buy/sell calls. Past patterns do not guarantee future results.
Have a goal in mind? Send a mutual fund enquiry or join a free educational webinar.
This article is for educational purposes only. Jashmi Investment / G. Deivasigamani is not a SEBI-registered Investment Adviser and does not provide investment advice or buy/sell calls.